A few weeks ago, we’ve argued in a paper in Nature that the Atlantic overturning circulation (sometimes popularly dubbed the Gulf Stream System) has weakened significantly since the late 19th Century, with most of the decline happening since the mid-20th Century. We have since received much praise for our study from colleagues around the world (thanks for that). But there were also some questions and criticisms in the media, so I’d like to present a forum here for discussing these questions and hope that others (particularly those with a different view) will weigh in in the comments section below. [Read more…] about If you doubt that the AMOC has weakened, read this
Stronger evidence for a weaker Atlantic overturning circulation
Through two new studies in Nature, the weakening of the Gulf Stream System is back in the scientific headlines. But even before that, interesting new papers have been published – high time for an update on this topic.
Let’s start with tomorrow’s issue of Nature, which besides the two new studies (one of which I was involved in) also includes a News&Views commentary. Everything revolves around the question of whether the Gulf Stream System has already weakened. Climate models predict this will be one consequence of global warming – alongside other problems such as rising sea levels and increasing heat waves, droughts and extreme precipitation. But is such a slowdown already underway today? This question is easier asked than answered. The Atlantic Meridional Overturning Circulation (AMOC, also known as Gulf Stream System) is a huge, three-dimensional flow system throughout the Atlantic, which fluctuates on different time scales. It is therefore by no means enough to put a current meter in the water at one or two points. [Read more…] about Stronger evidence for a weaker Atlantic overturning circulation
The global CO2 rise: the facts, Exxon and the favorite denial tricks
The basic facts about the global increase of CO2 in our atmosphere are clear and established beyond reasonable doubt. Nevertheless, I’ve recently seen some of the old myths peddled by “climate skeptics” pop up again. Are the forests responsible for the CO2 increase? Or volcanoes? Or perhaps the oceans?
Let’s start with a brief overview of the most important data and facts about the increase in the carbon dioxide concentration in the atmosphere:
- Since the beginning of industrialization, the CO2 concentration has risen from 280 ppm (the value of the previous millennia of the Holocene) to now 405 ppm.
- This increase by 45 percent (or 125 ppm) is completely caused by humans.
- The CO2 concentration is thus now already higher than it has been for several million years.
- The additional 125 ppm CO2 have a heating effect of 2 watts per square meter of earth surface, due to the well-known greenhouse effect – enough to raise the global temperature by around 1°C until the present.
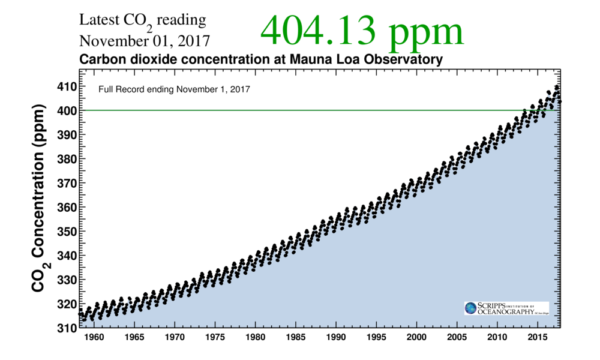
Fig. 1 Perhaps the most important scientific measurement series of the 20th century: the CO2 concentration of the atmosphere, measured on Mauna Loa in Hawaii. Other stations of the global CO2 measurement network show almost exactly the same; the most important regional variation is the greatly subdued seasonal cycle at stations in the southern hemisphere. This seasonal variation is mainly due to the “inhaling and exhaling” of the forests over the year on the land masses of the northern hemisphere. Source (updated daily): Scripps Institution of Oceanography. [Read more…] about The global CO2 rise: the facts, Exxon and the favorite denial tricks
El Niño and the record years 1998 and 2016
2017 is set to be one of warmest years on record. Gavin has been making regular forecasts of where 2017 will end up, and it is now set to be #2 or #3 in the list of hottest years:
With update thru September, ~80% chance of 2017 being 2nd warmest yr in the GISTEMP analysis (~20% for 3rd warmest). pic.twitter.com/k3CEM9rGHY
— Gavin Schmidt (@ClimateOfGavin) October 17, 2017
In either case it will be the warmest year on record that was not boosted by El Niño. I’ve been asked several times whether that is surprising. After all, the El Niño event, which pushed up the 2016 temperature, is well behind us. El Niño conditions prevailed in the tropical Pacific from October 2014 throughout 2015 and in the first half of 2016, giving way to a cold La Niña event in the latter half of 2016. (Note that global temperature lags El Niño variations by several months so this La Niña should have cooled 2017.) [Read more…] about El Niño and the record years 1998 and 2016
Is there really still a chance for staying below 1.5 °C global warming?
There has been a bit of excitement and confusion this week about a new paper in Nature Geoscience, claiming that we can still limit global warming to below 1.5 °C above preindustrial temperatures, whilst emitting another ~800 Gigatons of carbon dioxide. That’s much more than previously thought, so how come? And while that sounds like very welcome good news, is it true? Here’s the key points.
Emissions budgets – a very useful concept
First of all – what the heck is an “emissions budget” for CO2? Behind this concept is the fact that the amount of global warming that is reached before temperatures stabilise depends (to good approximation) on the cumulative emissions of CO2, i.e. the grand total that humanity has emitted. That is because any additional amount of CO2 in the atmosphere will remain there for a very long time (to the extent that our emissions this century will like prevent the next Ice Age due to begin 50 000 years from now). That is quite different from many atmospheric pollutants that we are used to, for example smog. When you put filters on dirty power stations, the smog will disappear. When you do this ten years later, you just have to stand the smog for a further ten years before it goes away. Not so with CO2 and global warming. If you keep emitting CO2 for another ten years, CO2 levels in the atmosphere will increase further for another ten years, and then stay higher for centuries to come. Limiting global warming to a given level (like 1.5 °C) will require more and more rapid (and thus costly) emissions reductions with every year of delay, and simply become unattainable at some point.
It’s like having a limited amount of cake. If we eat it all in the morning, we won’t have any left in the afternoon. The debate about the size of the emissions budget is like a debate about how much cake we have left, and how long we can keep eating cake before it’s gone. Thus, the concept of an emissions budget is very useful to get the message across that the amount of CO2 that we can still emit in total (not per year) is limited if we want to stabilise global temperature at a given level, so any delay in reducing emissions can be detrimental – especially if we cross tipping points in the climate system, e.g trigger the complete loss of the Greenland Ice Sheet. Understanding this fact is critical, even if the exact size of the budget is not known.
But of course the question arises: how large is this budget? There is not one simple answer to this, because it depends on the choice of warming limit, on what happens with climate drivers other than CO2 (other greenhouse gases, aerosols), and (given there’s uncertainties) on the probability with which you want to stay below the chosen warming limit. Hence, depending on assumptions made, different groups of scientists will estimate different budget sizes.
Computing the budget
The standard approach to computing the remaining carbon budget is:
(1) Take a bunch of climate and carbon cycle models, start them from preindustrial conditions and find out after what amount of cumulative CO2 emissions they reach 1.5 °C (or 2 °C, or whatever limit you want).
(2) Estimate from historic fossil fuel use and deforestation data how much humanity has already emitted.
The difference between those two numbers is our remaining budget. But there are some problems with this. The first is that you’re taking the difference between two large and uncertain numbers, which is not a very robust approach. Millar et al. fixed this problem by starting the budget calculation in 2015, to directly determine the remaining budget up to 1.5 °C. This is good – in fact I suggested doing just that to my colleague Malte Meinshausen back in March. Two further problems will become apparent below, when we discuss the results of Millar et al.
So what did Millar and colleagues do?
A lot of people were asking this, since actually it was difficult to see right away why they got such a surprisingly large emissions budget for 1.5 °C. And indeed there is not one simple catch-all explanation. Several assumptions combined made the budget so big.
The temperature in 2015
To compute a budget from 2015 to “1.5 °C above preindustrial”, you first need to know at what temperature level above preindustrial 2015 was. And you have to remove short-term variability, because the Paris target applies to mean climate. Millar et al. concluded that 2015 was 0.93 °C above preindustrial. That’s a first point of criticism, because this estimate (as Millar confirmed to me by email) is entirely based on the Hadley Center temperature data, which notoriously have a huge data gap in the Arctic. (Here at RealClimate we were actually the first to discuss this problem, back in 2008.) As the Arctic has warmed far more than the global mean, this leads to an underestimate of global warming up to 2015, by 0.06 °C when compared to the Cowtan&Way data or by 0.17 °C when compared to the Berkeley Earth data, as Zeke Hausfather shows in detail over at Carbon Brief.
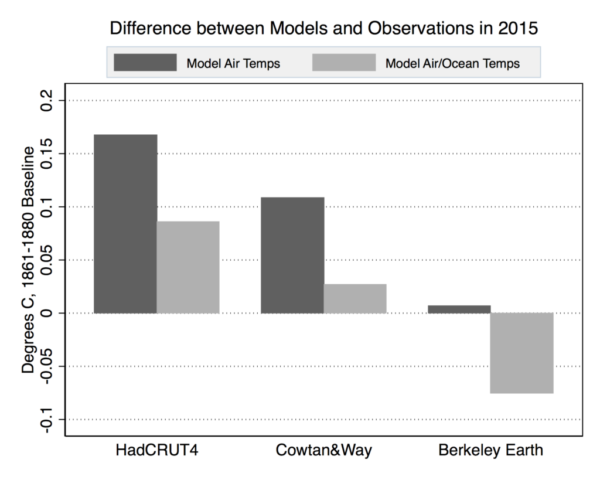
Figure: Difference between modeled and observed warming in 2015, with respect to the 1861-1880 average. Observational data has had short-term variability removed per the Otto et al 2015 approach used in the Millar et al 2017. Both RCP4.5 CMIP5 multimodel mean surface air temperatures (via KNMI) and blended surface air/ocean temperatures (via Cowtan et al 2015) are shown – the latter provide the proper “apples-to-apples” comparison. Chart by Carbon Brief.
As a matter of fact, as Hausfather shows in a second graph, HadCRUT4 is the outlier data set here, and given the Arctic data gap we’re pretty sure it is not the best data set. So, while the large budget of Millar et al. is based on the idea that we have 0.6 °C to go until 1.5 °C, if you believe (with good reason) that the Berkeley data are more accurate we only have 0.4 °C to go. That immediately cuts the budget of Millar et al. from 242 GtC to 152 GtC (their Table 2). [A note on units: you need to always check whether budgets are given in billion tons of carbon (GtC) or billion tons of carbon dioxide. 1 GtC = 3.7 GtCO2, so those 242 GtC are the same as 887 GtCO2.] Gavin managed to make this point in a tweet:
Headline claim from carbon budget paper that warming is 0.9ºC from pre-I is unsupported. Using globally complete estimates ~1.2ºC (in 2015) pic.twitter.com/B4iImGzeDE
— Gavin Schmidt (@ClimateOfGavin) September 20, 2017
Add to that the question of what years define the “preindustrial” baseline. Millar et al. use the period 1861-80. For example, Mike has argued that the period AD 1400-1800 would be a more appropriate preindustrial baseline (Schurer et al. 2017). That would add 0.2 °C to the anthropogenic warming that has already occurred, leaving us with just 0.2 °C and almost no budget to go until 1.5 °C. So in summary, the assumption by Millar et al. that we still have 0.6 °C to go up to 1.5 °C is at the extreme high end of how you might estimate that remaining temperature leeway, and that is one key reason why their budget is large. The second main reason follows.
To exceed or to avoid…
Here is another problem with the budget calculation: the model scenarios used for this actually exceed 1.5 °C warming. And the 1.5 °C budget is taken as the amount emitted by the time when the 1.5 °C line is crossed. Now if you stop emitting immediately at this point, of course global temperature will rise further. From sheer thermal inertia of the oceans, but also because if you close down all coal power stations etc., aerosol pollution in the atmosphere, which has a sizeable cooling effect, will go way down, while CO2 stays high. So with this kind of scenario you will not limit global warming to 1.5 °C. This is called a “threshold exceedance budget” or TEB – Glen Peters has a nice explainer on that (see his Fig. 3). All the headline budget numbers of Millar et al., shown in their Tables 1 and 2, are TEBs. What we need to know, though, is “threshold avoidance budgets”, or TAB, if we want to stay below 1.5 °C.
Millar et al also used a second method to compute budgets, shown in their Figure 3. However, as Millar told me in an email, these “simple model budgets are neither TEBs nor TABs (the 66 percentile line clearly exceeds 1.5 °C in Figure 3a), they are instead net budgets between the start of 2015 and the end of 2099.” What they are is budgets that cause temperature to exceed 1.5 °C in mid-century, but then global temperature goes back down to 1.5 °C in the year 2100!
In summary, both approaches used by Millar compute budgets that do not actually keep global warming to 1.5 °C.
How some media (usual suspects in fact) misreported
We’ve seen a bizarre (well, if you know the climate denialist scene, not so bizarre) misreporting about Millar et al., focusing on the claim that climate models have supposedly overestimated global warming. Carbon Brief and Climate Feedback both have good pieces up debunking this claim, so I won’t delve into it much. Let me just mention one key aspect that has been misunderstood. Millar et al. wrote the confusing sentence: “in the mean CMIP5 response cumulative emissions do not reach 545GtC until after 2020, by which time the CMIP5 ensemble-mean human-induced warming is over 0.3 °C warmer than the central estimate for human-induced warming to 2015”. As has been noted by others, this is comparing model temperatures after 2020 to an observation-based temperature in 2015, and of course the latter is lower – partly because it is based on HadCRUT4 data as discussed above, but equally so because of comparing different points in time. This is because it refers to the point when 545 GtC is reached. But the standard CMIP5 climate models used here are not actually driven by emissions at all, but by atmospheric CO2 concentrations. For the historic period, these are taken from observed data. So the fact that 545 GtC are reached too late doesn’t even refer to the usual climate model scenarios. It refers to estimates of emissions by carbon cycle models, which are run in an attempt to derive the emissions that would have led to the observed time evolution of CO2 concentration.
Does it all matter?
We still live in a world on a path to 3 or 4 °C global warming, waiting to finally turn the tide of rising emissions. At this point, debating whether we have 0.2 °C more or less to go until we reach 1.5 °C is an academic discussion at best, a distraction at worst. The big issue is that we need to see falling emissions globally very very soon if we even want to stay well below 2 °C. That was agreed as the weaker goal in Paris in a consensus by 195 nations. It is high time that everyone backs this up with actions, not just words.
Technical p.s. A couple of less important technical points. The estimate of 0.93 °C above 1861-80 used by Millar et al. is an estimate of the human-caused warming. I don’t know whether the Paris agreement specifies to limit human-caused warming, or just warming, to 1.5 °C – but in practice it does not matter, since the human-caused warming component is almost exactly 100 % of the observed warming. Using the same procedure as Millar yields 0.94 °C for total observed climate warming by 2015, according to Hausfather.
However, updating the statistical model used to derive the 0.93 °C anthropogenic warming to include data up to 2016 gives an anthropogenic warming of 0.96 °C in 2015.
Weblink
Statement by Millar and coauthors pushing back against media misreporting. Quote: “We find that, to likely meet the Paris goal, emission reductions would need to begin immediately and reach zero in less than 40 years’ time.”
The climate has always changed. What do you conclude?
Probably everyone has heard this argument, presented as objection against the findings of climate scientists on global warming: “The climate has always changed!” And it is true: climate has changed even before humans began to burn fossil fuels. So what can we conclude from that?
A quick quiz
Do you conclude…
(1) that humans cannot change the climate?
(2) that we do not know whether humans are to blame for global warming?
(3) that global warming will not have any severe consequences?
(4) that we cannot stop global warming? [Read more…] about The climate has always changed. What do you conclude?
Why global emissions must peak by 2020
(by Stefan Rahmstorf and Anders Levermann)
In the landmark Paris Climate Agreement, the world’s nations have committed to “holding the increase in the global average temperature to well below 2 °C above pre-industrial levels and to pursue efforts to limit the temperature increase to 1.5 °C above pre-industrial levels”. This goal is deemed necessary to avoid incalculable risks to humanity, and it is feasible – but realistically only if global emissions peak by the year 2020 at the latest.
Let us first address the importance of remaining well below 2°C of global warming, and as close to 1.5°C as possible. The World Meteorological Organization climate report[i] for the past year has highlighted that global temperature and sea levels keep rising, reaching record highs once again in 2016. Global sea ice cover reached a record low, and mountain glaciers and the huge ice sheets in Greenland and Antarctica are on a trajectory of accelerating mass loss. More and more people are suffering from increasing and often unprecedented extreme weather events[ii], both in terms of casualties and financial losses. This is the situation after about 1°C global warming since the late 19th Century. [Read more…] about Why global emissions must peak by 2020
Fake news, hacked mail, alternative facts – that’s old hat for climate scientists
Distortion? False information? Conspiracy theories? Hacked email? Climate scientists have known all this for decades. What can be learned from their rich experience with climate propaganda.
The world is slowly waking up. “Post-truth” was declared the word of the year 2016 by the Oxford Dictionaries. Finally, people start to widely appreciate how dangerous the epidemic of fake news is for democracy.
Stir up hate, destroy discourse, make insane claims until no one can distinguish the most bizarre absurdity from the truth any more.
Thus the Austrian author Robert Misik aptly describes the strategy of right-wing populists.
Some call it “alternative facts”. (Those are the convenient alternative to true facts.) Let’s simply call it propaganda. [Read more…] about Fake news, hacked mail, alternative facts – that’s old hat for climate scientists
The NASA data conspiracy theory and the cold sun
When climate deniers are desperate because the measurements don’t fit their claims, some of them take the final straw: they try to deny and discredit the data.
The years 2014 and 2015 reached new records in the global temperature, and 2016 has done so again. Some don’t like this because it doesn’t fit their political message, so they try to spread doubt about the observational records of global surface temperatures. A favorite target are the adjustments that occur as these observational records are gradually being vetted and improved by adding new data and eliminating artifacts that arise e.g. from changing measurement practices or the urban heat island effect. More about this is explained in this blog article by Victor Venema from Bonn University, a leading expert on homogenization of climate data. And of course the new paper by Hausfather et al, that made quite a bit of news recently, documents how meticulously scientists work to eliminate bias in sea surface temperature data, in this case arising from a changing proportion of ship versus buoy observations. [Read more…] about The NASA data conspiracy theory and the cold sun
The underestimated danger of a breakdown of the Gulf Stream System
A new model simulation of the Gulf Stream System shows a breakdown of the gigantic overturning circulating in the Atlantic after a CO2 doubling.
A new study in Science Advances by Wei Liu and colleagues at the Scripps Institution of Oceanography in San Diego and the University of Wisconsin-Madison has important implications for the future stability of the overturning circulation in the Atlantic Ocean. They applied a correction to the freshwater fluxes in the Atlantic, in order to better reproduce the salt concentration of ocean waters there. This correction changes the overall salt budget for the Atlantic, also changing the stability of the model’s ocean circulation in future climate change. The Atlantic ocean circulation is relatively stable in the uncorrected model, only declining by about 20% in response to a CO2 doubling, but in the corrected model version it breaks down completely in the centuries following a CO2 doubling, with dramatic consequences for the climate of the Northern Hemisphere. [Read more…] about The underestimated danger of a breakdown of the Gulf Stream System