I am always interested in non-traditional data sets that can shed some light on climate changes. Ones that I’ve discussed previously are the frequency of closing of the Thames Barrier and the number of vineyards in England. With the exceptional warmth in Alaska last month (which of course was coupled with colder temperatures elsewhere), I was reminded of another one, the Nenana Ice Classic.
[Read more…] about The Nenana Ice Classic and climate
It never rains but it pause
There has been a veritable deluge of new papers this month related to recent trends in surface temperature. There are analyses of the CMIP5 ensemble, new model runs, analyses of complementary observational data, attempts at reconciliation all the way to commentaries on how the topic has been covered in the media and on twitter. We will attempt to bring the highlights together here. As background, it is worth reading our previous discussions, along with pieces by Simon Donner and Tamino to help put in context what is being discussed here.
New climate science MOOCs
Along with David’s online class a number of new climate science Massive Online Open Courses (MOOCs) are now coming online.
Thames Barrier raised again
 Back in 2007 I wrote a post looking at the closures of the Thames Barrier since construction finished in 1983. Since then there has been another 7 years of data* and given that there was a spate of closures last week due to both river and tidal flooding, it seems a good time to revisit the topic.
AGU talk on science and advocacy
We have often discussed issues related to science communication on this site, and the comment threads frequently return to the issue of advocacy, the role of scientists and the notion of responsibility. Some videos from the recent AGU meeting are starting to be uploaded to the AGU Youtube channel and, oddly, the first video of a talk is my Stephen Schneider lecture on what climate scientists should advocate for (though actually, it mostly about how science communicators should think about advocacy in general since the principles are applicable regardless of the subject area):
The IPCC AR5 attribution statement
Last year I discussed the basis of the AR4 attribution statement:
Most of the observed increase in global average temperatures since the mid-20th century is very likely due to the observed increase in anthropogenic greenhouse gas concentrations.
In the new AR5 SPM (pdf), there is an analogous statement:
It is extremely likely that more than half of the observed increase in global average surface temperature from 1951 to 2010 was caused by the anthropogenic increase in greenhouse gas concentrations and other anthropogenic forcings together. The best estimate of the human-induced contribution to warming is similar to the observed warming over this period.
This includes differences in the likelihood statement, drivers and a new statement on the most likely amount of anthropogenic warming.
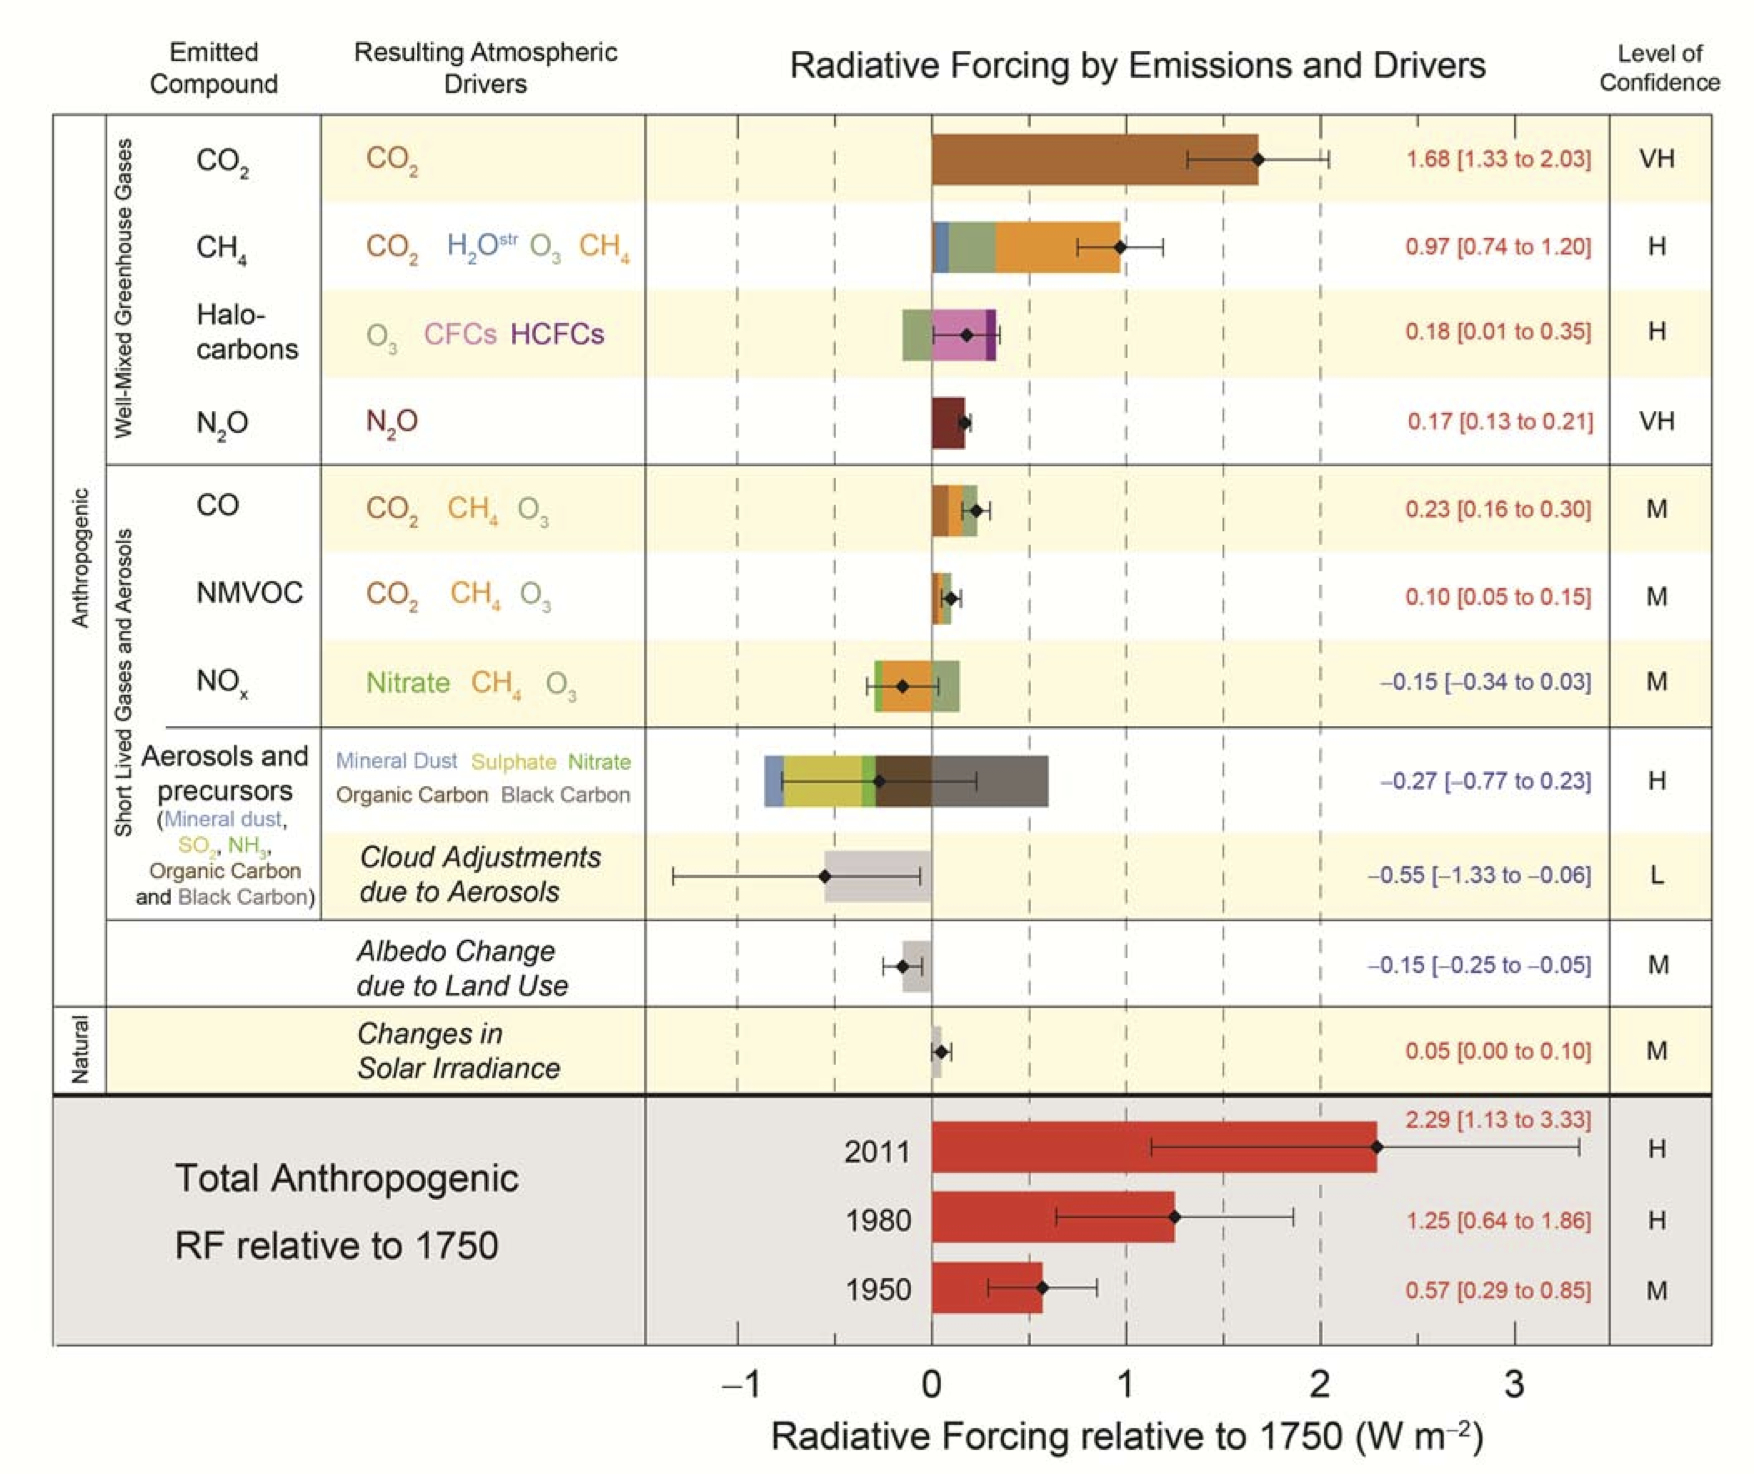
The evolution of radiative forcing bar-charts
As part of the IPCC WG1 SPM (pdf) released last Friday, there was a subtle, but important, change in one of the key figures – the radiative forcing bar-chart (Fig. SPM.4). The concept for this figure has been a mainstay of summaries of climate change science for decades, and the evolution over time is a good example of how thinking and understanding has progressed over the years while the big picture has not shifted much.
The Radiative-Forcing bar chart: AR5 version
[Read more…] about The evolution of radiative forcing bar-charts
On mismatches between models and observations
It is a truism that all models are wrong. Just as no map can capture the real landscape and no portrait the true self, numerical models by necessity have to contain approximations to the complexity of the real world and so can never be perfect replications of reality. Similarly, any specific observations are only partial reflections of what is actually happening and have multiple sources of error. It is therefore to be expected that there will be discrepancies between models and observations. However, why these arise and what one should conclude from them are interesting and more subtle than most people realise. Indeed, such discrepancies are the classic way we learn something new – and it often isn’t what people first thought of.
[Read more…] about On mismatches between models and observations
Arctic misrepresentations
At the weekend, Christopher Booker at the Daily Telegraph made another attempt (see previous) to downplay the obvious decreases in Arctic sea ice by (mis-)quoting a statement from Arctic oceanographer Ken Drinkwater and colleagues:
[Read more…] about Arctic misrepresentations
AGU Chapman Conference on Climate Science Communication
A couple of weeks ago, there was a small conference on Climate Science communication run by the AGU. Both Mike and I attended, but it was very notable that it wasn’t just scientists attending – there were also entertainers, psychologists, film-makers and historians. There were a lot of quite diverse perspectives and many discussions about the what’s, why’s and how’s of climate science communication.
There were a couple of notable features: the conference had a lively twitter hashtag (#climatechapman), and almost the entire proceedings were webcast live (schedule). The video from this has now been posted on YouTube in more bite-sized chunks.
While our own presentations (Mike here and Gavin here) are available, it is worth watching the presentations from people you might not have heard of, as well as a few from more established people. We’ll embed a few here, but please point out some of the other ones of interest in the comments.
[Read more…] about AGU Chapman Conference on Climate Science Communication